
New - 30 Mins Ago



Homes across Greater Nashville took longer to sell in October, more of them sat on the market, and the typical price barely moved. Greater Nashville Realtors reported 2,540 closings for the month on November 5, 2026, down 12% from 2,886 a year earlier, while the residential median slipped just 2.9% to $499,990. For buyers, that adds up to more choices and more time. For sellers, it puts more weight on pricing and condition from day one.
This update walks through the October numbers, the latest mortgage rate, and what our team is seeing on the ground. New to the area? Start with our guide to moving to Nashville, or browse homes for sale across Davidson County while you read.
Here's what we'll cover:
These figures come from the Greater Nashville Realtors monthly release dated November 5, 2026, built on RealTracs data for nine counties: Davidson, Cheatham, Dickson, Maury, Robertson, Rutherford, Sumner, Williamson, and Wilson.
Jack Gaughan, the group's 2026 president, summed it up in the release: buyers now have more choices and potentially greater negotiating leverage, while softer demand has not caused an equally large drop in prices.
Fall usually cools the Nashville market, and this year followed that pattern. Here is how October compared with September, using the same Greater Nashville Realtors monthly data.
| Measure | September 2026 | October 2026 |
|---|---|---|
| Total closings | 2,885 | 2,540 |
| Residential median | $510,000 | $499,990 |
| Condo median | $331,780 | $343,776 |
| Pending sales | 2,045 | 1,805 |
| Active listings | 15,536 | 15,379 |
| Average days to contract (single-family) | 57 | 61 |
Source: Greater Nashville Realtors monthly home sales reports for September and October 2026 (nine-county region). These are regional totals, so your county, ZIP code, and price range can look different.
The bigger seasonal story shows up over the summer. The Nashville Ledger, citing Greater Nashville Realtors data, reported that monthly sales fell from 3,459 in June to 2,885 in September, while the single-family median eased from $537,000 in May to $510,000 in September. October continued that slide in sales volume, with prices drifting rather than dropping hard.
A 12% drop in closings paired with a 2.9% dip in the median tells you most sellers are not slashing prices across the board. Part of the change also comes from which homes are selling. Axios Nashville reported on October 19, 2026, using Greater Nashville Realtors third-quarter data, that sales between $1 million and $1.9 million rose 11% from a year earlier, while every price bracket under $1 million saw fewer sales. When the mix of sales shifts, the median moves too, even if a typical house on your street holds its value.
Inside Nashville's city limits, Redfin's market page (checked November 8, 2026) showed a $464,779 median sale price over its latest three months of data, down 1.1% from a year earlier, at about $263 per square foot. Shopping the upper end? Browse Nashville luxury homes to see how that segment is priced today.

The Cumberland Pedestrian Bridge links the Stones River and Shelby Bottoms greenways on Nashville's east side.
Inventory is the number to watch this winter. The region ended October with 15,379 active listings, up 8% from a year earlier, and Greater Nashville Realtors put supply at about 6.83 months. A common rule of thumb treats roughly six months of supply as the line where conditions start to favor buyers, so the region is sitting right around that mark. Single-family homes averaged 61 days to contract in October, up from 57 in September.
Redfin's Nashville city data points the same way. Over its latest three months, 38.3% of homes had a price drop, 13.6% sold above list price, and homes sold for about 97.4% of list price on average. Homes are still selling. Buyers are simply taking longer to commit.
Freddie Mac's Primary Mortgage Market Survey put the 30-year fixed rate at 7.18% for the week of November 5, 2026, down from 7.24% the week before and the third straight weekly decline. A year earlier it was 6.22%. The 15-year fixed averaged 6.57%. Rates move every week, so run your own numbers with our mortgage calculator and home affordability calculator before you set a budget.
With more than 15,000 listings across the region, you can tour several homes in your price range and compare them side by side. Fewer buyers are competing for each listing than in the spring, which gives you time for inspections and a second showing.
A home that has sat for 60 days or more often has a seller ready to talk about price, closing costs, or a rate buydown. Ask what the seller would consider before you write the offer. First-time buyer? Our first-time home buyer guide walks through the steps from pre-approval to closing.
Builders in the region often offer incentives when resale inventory is high. Browse new construction homes in Nashville and compare them against resale using our new construction vs. existing homes guide. Condo buyers saw the October condo median at $343,776. Our condo and townhome buying page covers HOA questions to ask before you sign.
Buyers in this market compare every listing against the others in their search. A home priced to recent sales on its own street tends to draw showings in the first two weeks, when interest runs highest. Our seller resources explain how we build a pricing plan, and our home sale calculator estimates what you would walk away with.
When buyers have choices, a fresh coat of paint, a clean inspection, and good photos matter. Fix the small items a buyer would flag, and think about a pre-listing inspection if your home is older.
Thinking about selling your Nashville home? Get a free home value from MaX House and see where you stand before you decide anything.
Location still drives value in Middle Tennessee. Two U.S. Army Corps of Engineers lakes sit close to downtown: J. Percy Priest Lake to the east and Old Hickory Lake to the northeast. Shopping for water access? Browse Nashville waterfront homes. Drive times from downtown Nashville, from OSRM routing estimates run on November 8, 2026, in light traffic (rush hour runs longer):
I-65, I-24, and I-40 all meet downtown, and I-840 loops around the southern suburbs. The WeGo Star commuter train runs east to Mount Juliet and Lebanon on weekdays.

J. Percy Priest Lake, about 15 to 20 minutes east of downtown Nashville.
Nashville neighborhoods range from historic brick homes in Germantown to newer townhomes in the suburbs. Comparing counties on a budget? Our guide to where to buy near Nashville under $800K compares Williamson, Rutherford, Wilson, and Sumner, and our condo and townhome buyer guide covers attached homes inside the city.

The Buddeke-Byrne House in Germantown, one of Nashville's oldest neighborhoods.
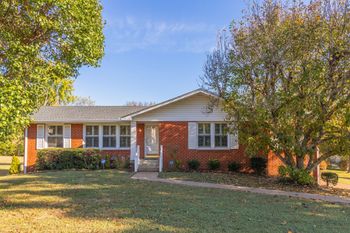
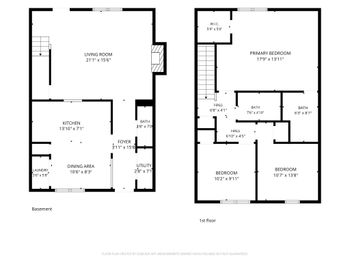
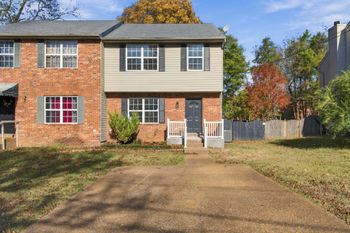
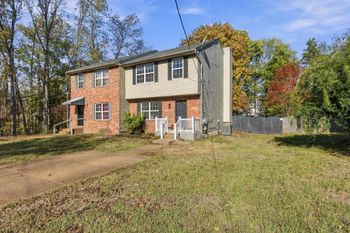
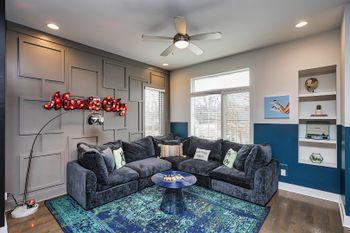
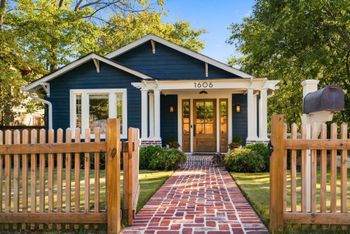
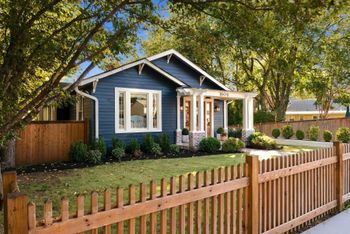
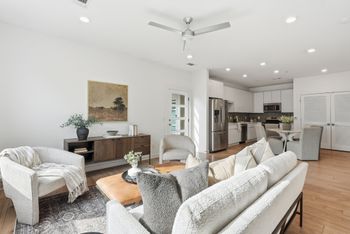
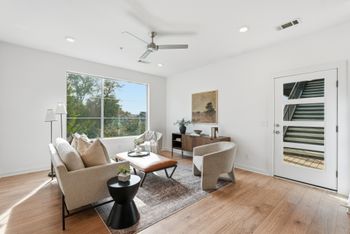
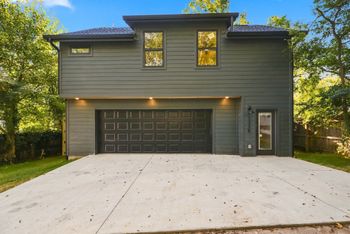
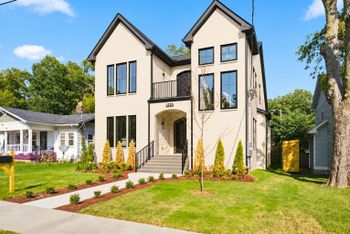
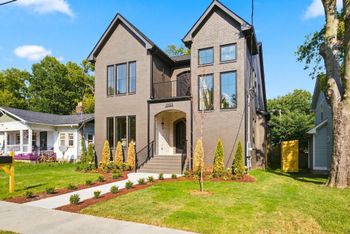
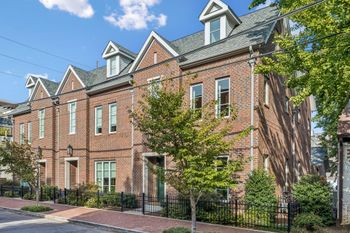
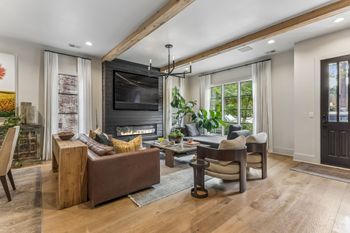
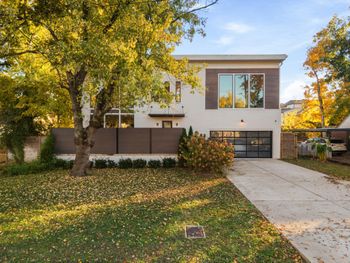
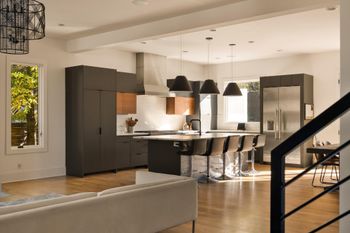
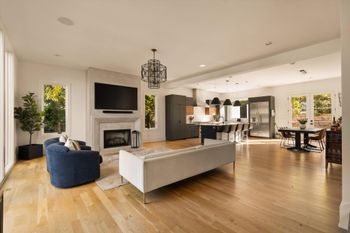
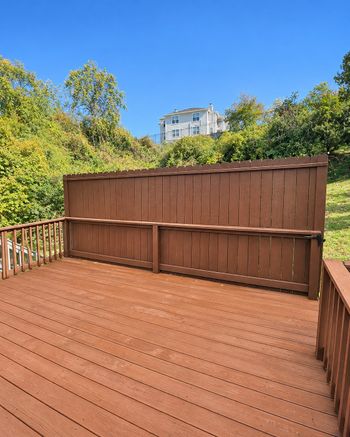
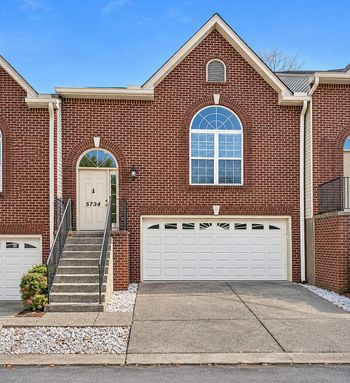
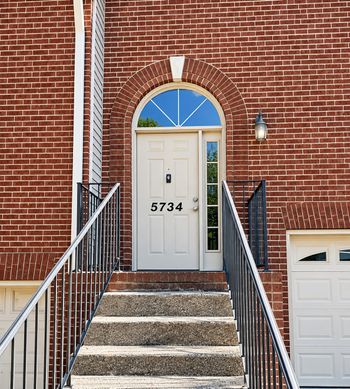
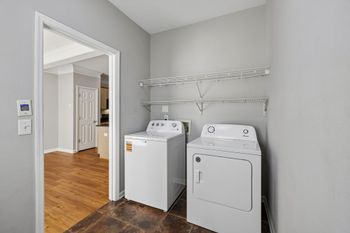
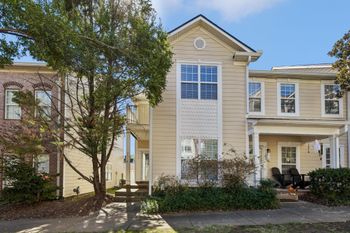
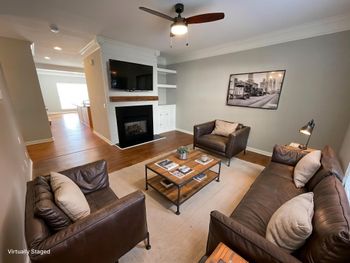
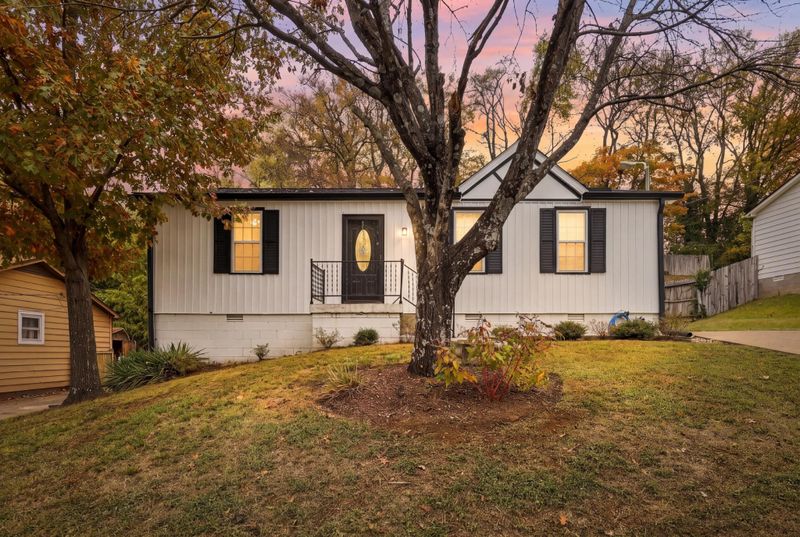
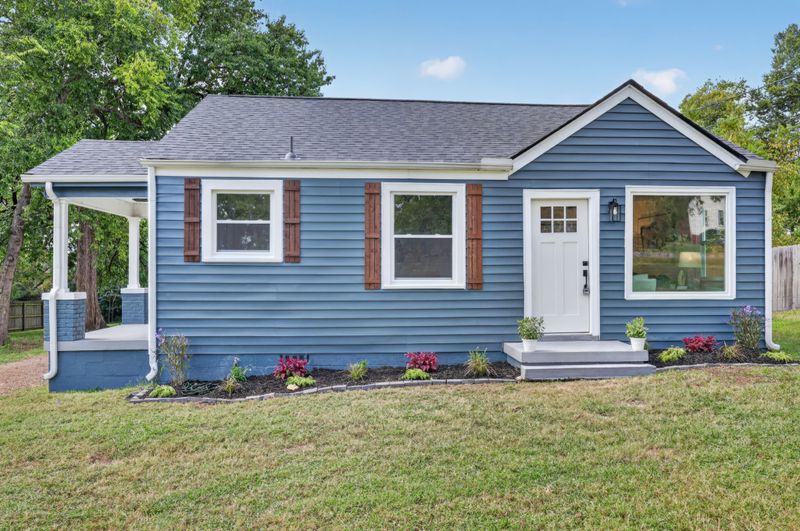
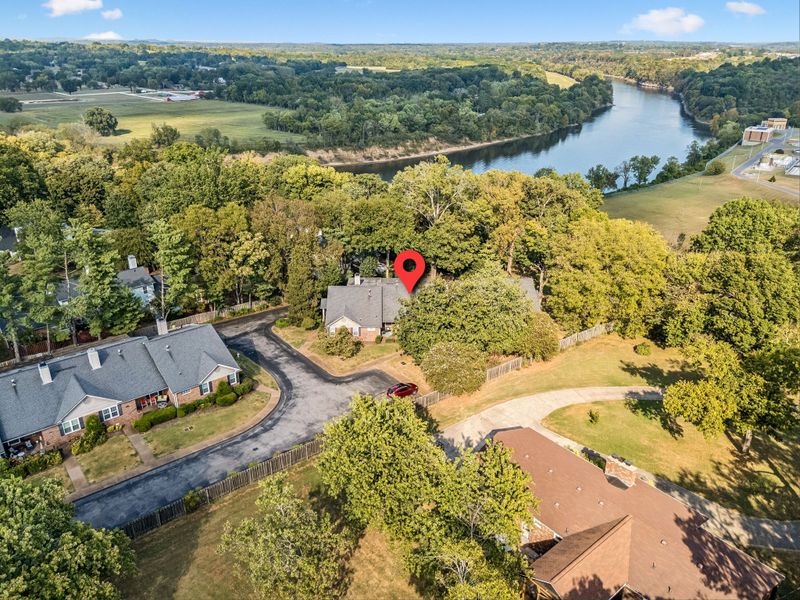
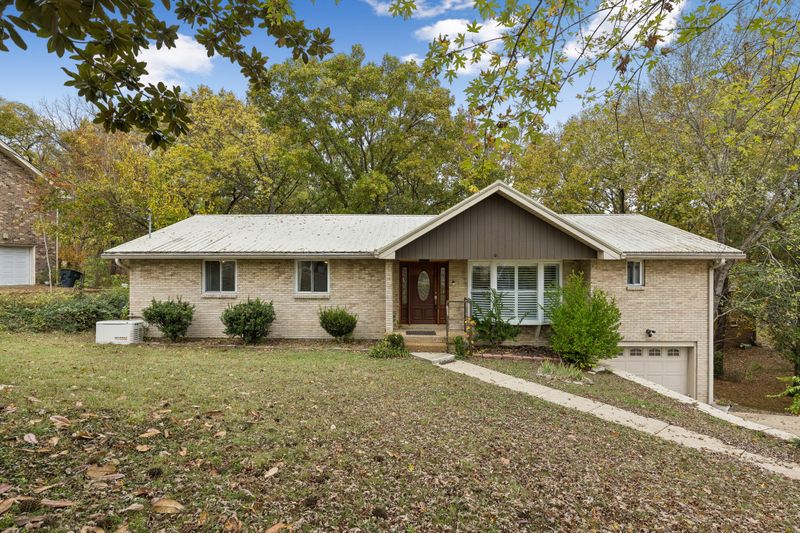
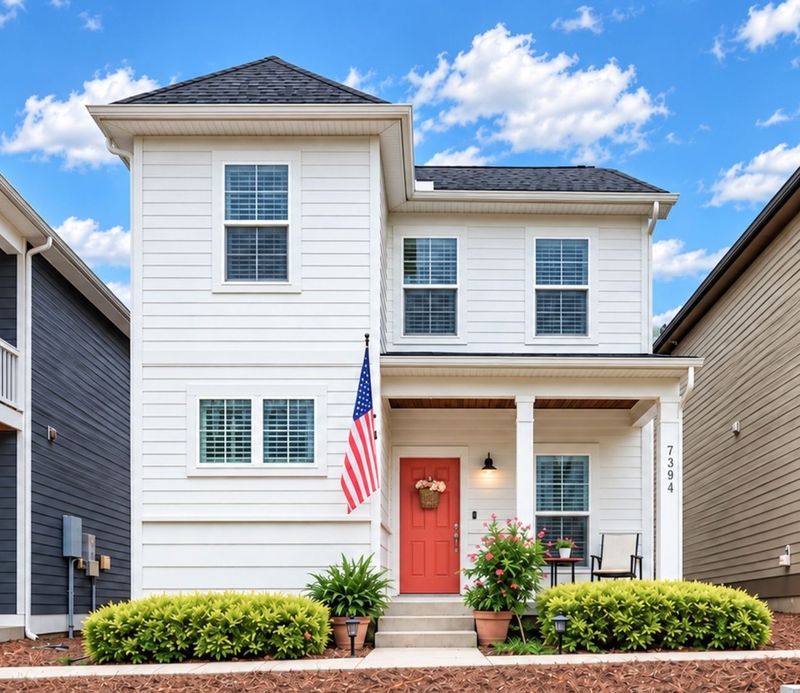
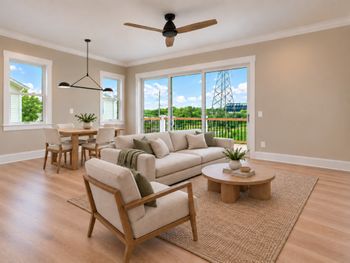
A sample of active Nashville listings from our site's IDX search, confirmed active on November 8, 2026, at prices on both sides of the regional median. Prices and status change quickly.
IDX information is provided exclusively for personal, non-commercial use, and may not be used for any purpose other than to identify prospective properties consumers may be interested in purchasing. Information is deemed reliable but not guaranteed.
For buyers who are ready, this fall and winter offer more inventory and more negotiating room than Nashville has seen in several years. Relocating from out of state? Our Greater Nashville relocation guide covers the wider move, and you can compare suburbs in Williamson County and Rutherford County on our county pages.
For sellers, timing depends on your next move more than on the calendar. If you need to sell this winter, price carefully and prepare the house well. If you can wait, spring traditionally brings more buyers, along with more competing listings. If y'all are weighing both options, we can pull recent sales on your street and walk through each path.
Greater Nashville Realtors reported a $499,990 residential median for October 2026 across nine counties, and a $343,776 condo median. Redfin's Nashville city page showed a $464,779 median over its latest three months as of November 8, 2026.
Conditions lean toward buyers. Greater Nashville Realtors reported about 6.83 months of supply in October, with fewer pending sales and more listings than a year earlier. Results vary by county and price range.
Single-family homes averaged 61 days to contract in October 2026, up from 57 days in September, per Greater Nashville Realtors.
Davidson, Cheatham, Dickson, Maury, Robertson, Rutherford, Sumner, Williamson, and Wilson counties.
Greater Nashville Realtors has released its monthly report in the first week of the following month, so November figures should arrive in early December 2026.
Want to know how these numbers apply to your home or your search? Reach out to our team and we'll put together a custom read on your neighborhood. MaX House, brokered by LPT Realty.
Find out what your current home could sell for, then get new Nashville listings sent to you the day they hit the market. Our team answers every request personally.
Cover photo: Nashville skyline at night from I-65 by Cessna86, public domain, via Wikimedia Commons. Photos: Cumberland Pedestrian Bridge by MaxKelley620, CC BY 4.0, via Wikimedia Commons; Percy Priest Lake by Melissa McMasters, CC BY 2.0, via Wikimedia Commons; Buddeke-Byrne House by Brent Moore, CC BY 2.0, via Wikimedia Commons.